When the Cats Take the Same Test
WHEN THE CATS TAKE THE SAME TEST
Section titled “WHEN THE CATS TAKE THE SAME TEST”Cross-Provider Experimental Design Under Identical Commander’s Intent
Section titled “Cross-Provider Experimental Design Under Identical Commander’s Intent”Jeep Marshall LTC, US Army (Retired) Airborne Infantry | Special Operations | Process Improvement March 2026
Series Note: This is Paper 6b in the Herding Cats in the AI Age series — a companion to Paper 6 (“When the Cats Form a Team”). Paper 6 tested whether a doctrine-structured ensemble of AI models outperforms a single model on a strategic decision. Paper 6b asks the next question: what happens when you give six AI systems the same complex task with identical instructions and no coordination structure? The answer — a 51% quality variance from the same Commander’s Intent — is itself the strongest argument for the doctrine layer Paper 6 validated.
EXECUTIVE SUMMARY
Section titled “EXECUTIVE SUMMARY”The provenance crisis that followed collection proved more valuable than the scores. The brief specified WHAT to produce but not HOW TO LABEL IT. No filename convention. No metadata header. One file landed in the wrong folder. The analyst compounded the problem by creating duplicate versions of its own analysis while writing about the version control problem. Four lines of output doctrine — the military calls this “orders production,” Step 7 of the MDMP — would have prevented every failure. The exercise designed to study coordination without discipline reproduced that failure in its own execution.
The identical-brief experiment is a multi-model evaluation harness — standardized input, structured output, quantitative scoring.1 It measures the baseline variance in output quality across providers before any coordination structure is applied. That variance is the dependent variable Paper 6’s thesis predicts doctrine reduces.
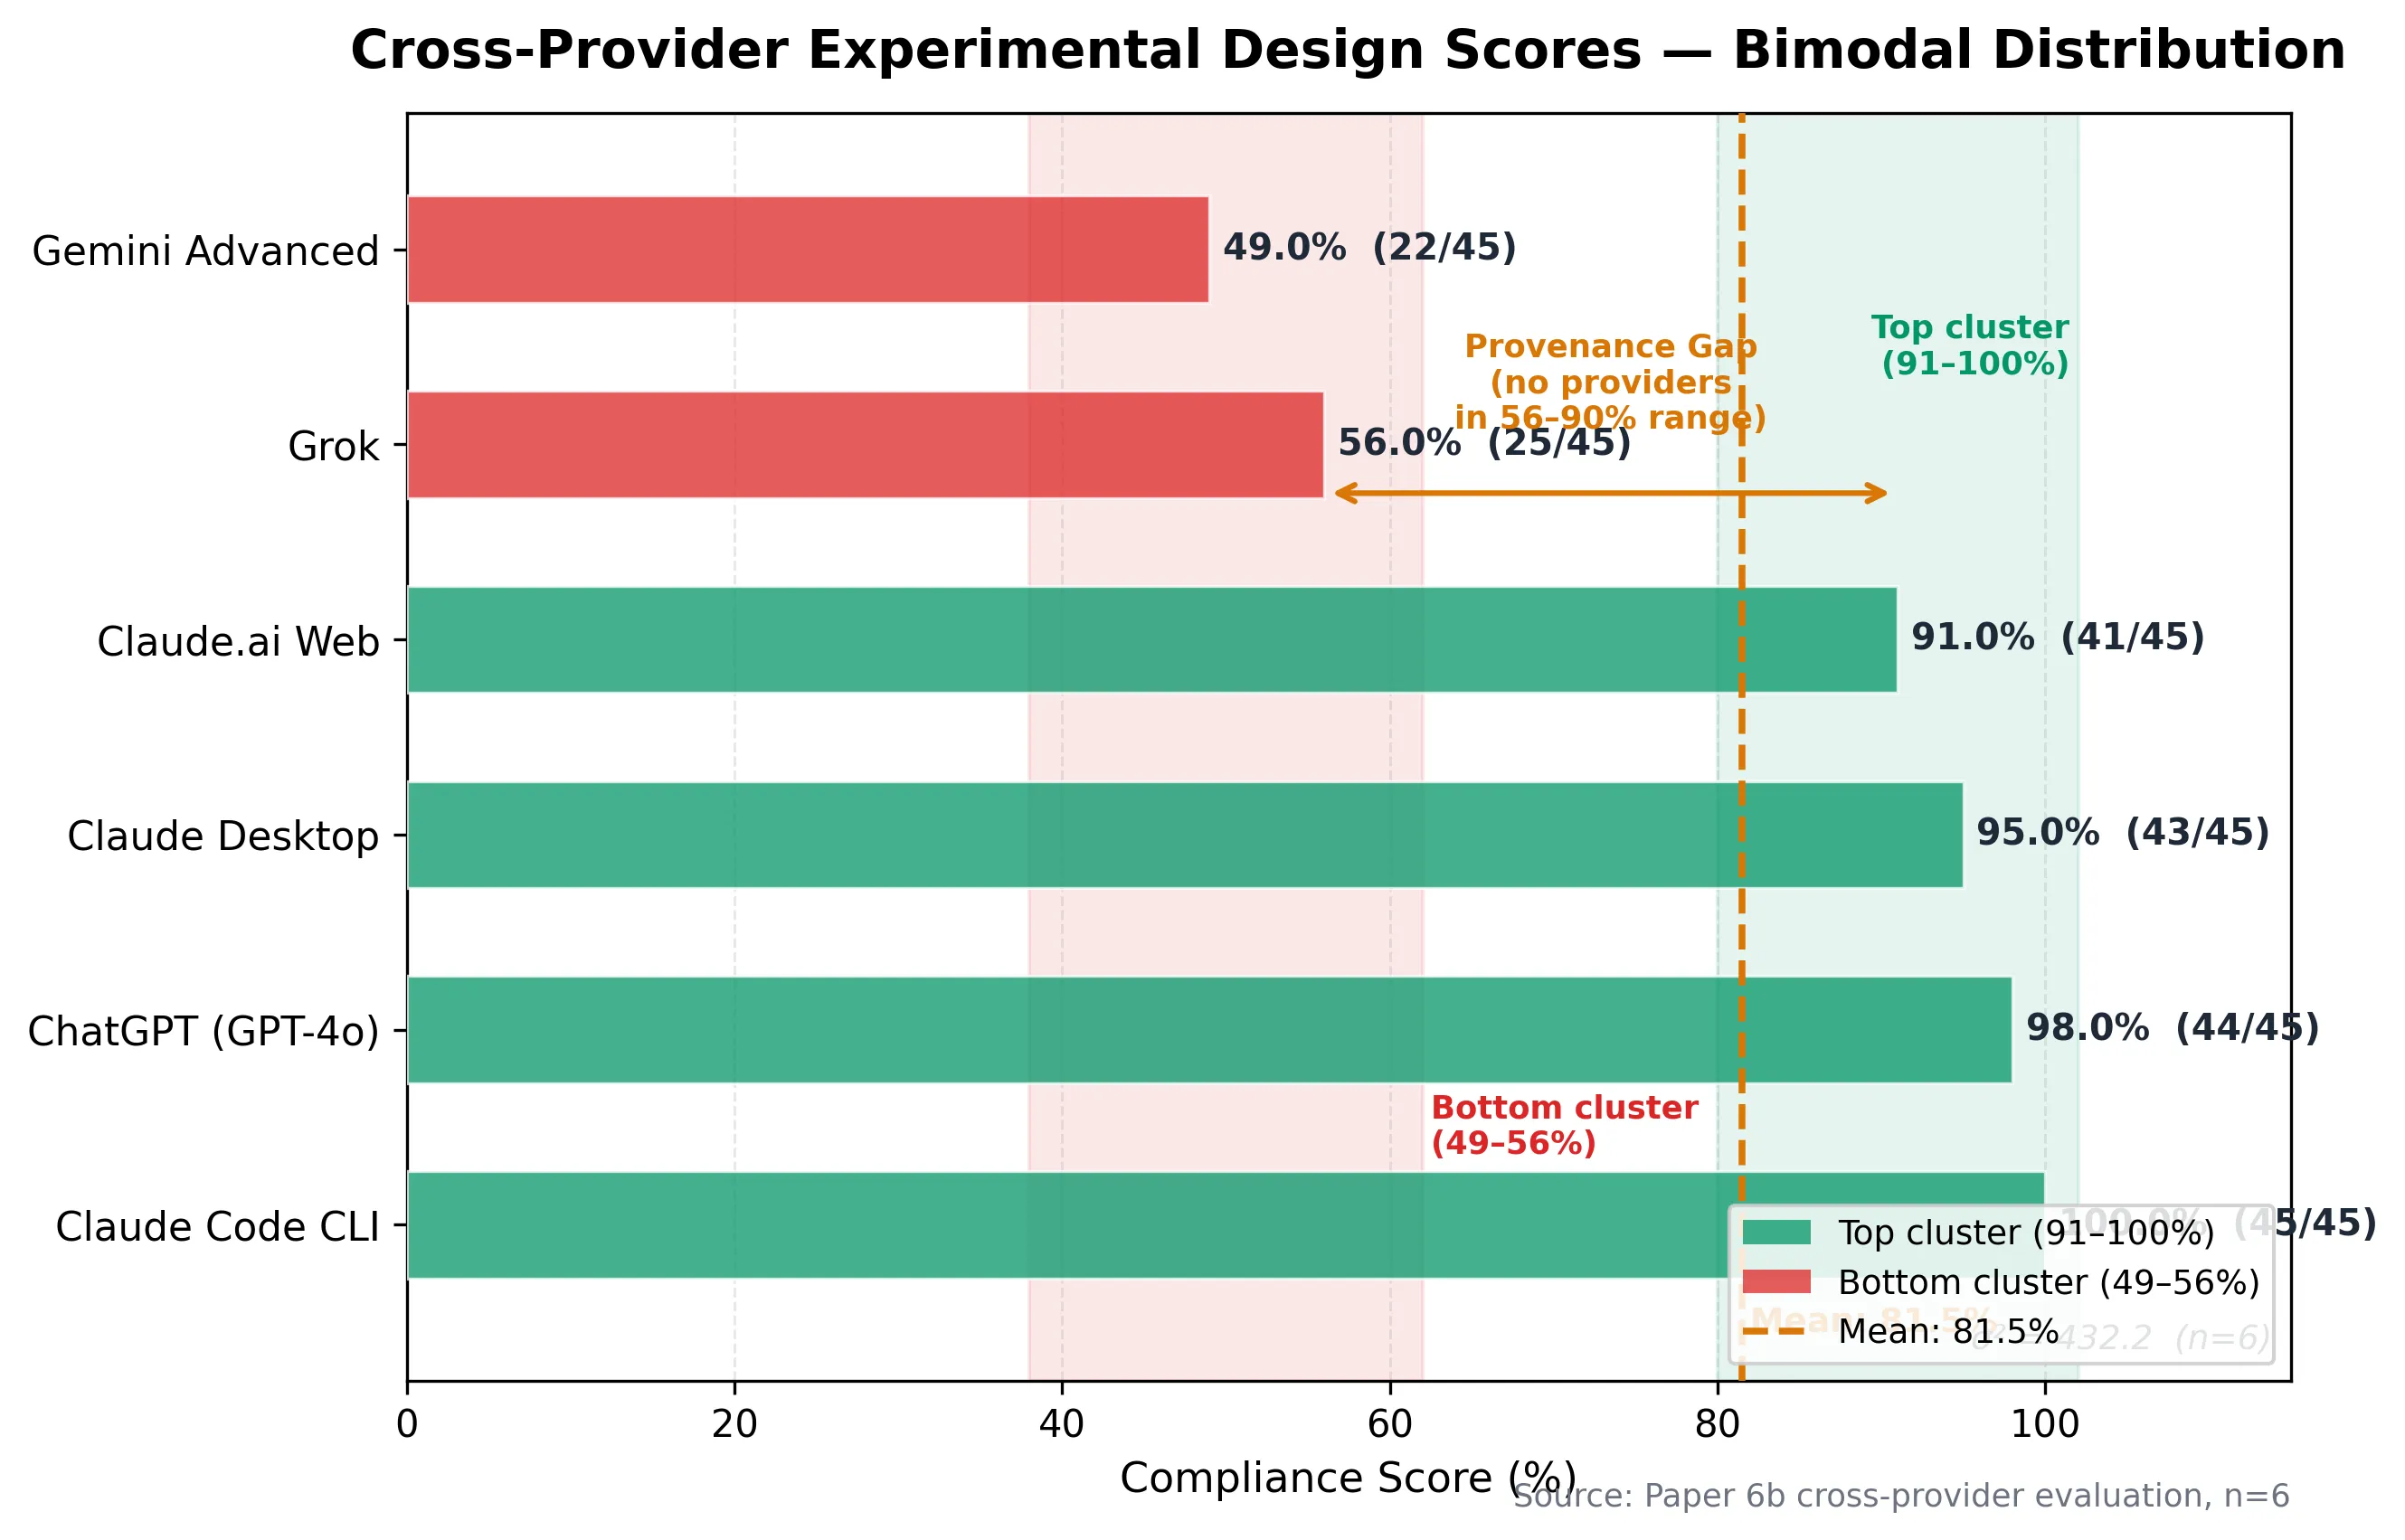
A 51% quality variance from identical instructions. Six AI systems, same brief, scores ranging from 49% to 100% (scores assigned by a single AI analyst; see Section 8 for methodology limitations and Round 2 mitigations). Quality variance σ² = 432.7 (n=6, x̄=78.2%), σ=20.8%.2 And then the collection process broke — misattributed files, no self-identifying metadata, 60 minutes of human forensic verification — because the brief that tested coordination discipline forgot to include four lines of output doctrine.
On March 17, 2026, six AI models received an identical 3,200-word mission brief ordering each to design a rigorous experiment for validating doctrine-structured multi-agent AI coordination. Scores ranged from 22/45 (one provider) to 45/45 (another).3 Scores were assigned by a single AI analyst using a rubric derived from the brief’s requirements; see Section 8 for methodology limitations and Round 2 mitigations. The top four producers delivered publication-grade experimental designs with validated statistics. The bottom two produced outlines a researcher could not execute. Four providers independently converged on the same experimental architecture — evidence the methodology is robust. Every provider contributed unique analytical value the others missed — evidence that ensemble synthesis outperforms individual analysis.
1. WHY THIS EXPERIMENT WITHIN AN EXPERIMENT
Section titled “1. WHY THIS EXPERIMENT WITHIN AN EXPERIMENT”Paper 6 proved that a doctrine-structured ensemble outperforms a solo model on strategic decisions. But the proof-of-concept was n=1 — one decision, one ensemble configuration, one session. The logical next step was to design a rigorous experiment with statistical power: multiple runs, controlled conditions, quantitative measurement, and formal hypothesis testing.
Rather than design that experiment alone, the researcher issued the design task itself as a cross-provider test. The reasoning was straightforward: if multiple AI systems can independently produce experimental protocols from the same Commander’s Intent, the convergent elements represent robust methodology, and the divergent elements reveal what each provider uniquely contributes. The exercise would also generate Round 1 data — a baseline measurement of output quality variance across providers that directly feeds Paper 6’s core thesis.
The mission brief was 3,200 words organized into six sections: Situation (market context and the null hypothesis), Commander’s Intent (end state and key requirements), Task Order (nine specified sections A through I), Methodology Guidance (MDMP and LSS-BB frameworks to apply during design), Format Standards (active voice, quantify everything, state assumptions), and Context (this validates Paper 6’s thesis for the “Herding Cats” series).4
Each provider received a platform-specific adapter — instructions tailored to each system’s unique capabilities. One system was directed to use code execution for statistical validation. Another was directed to use code interpretation for Monte Carlo simulations. A third was directed to use web search for benchmark research. The adapters expanded capability access but did not change the Commander’s Intent or task order.5
This cross-provider approach also tests model-agnostic experimental design. By specifying an identical brief and letting different models produce independent protocols, we isolate what constitutes robust experimental methodology (elements all models converge on) from what constitutes provider-specific analytical flavor (elements that diverge). The test methodology itself is platform-independent and replicable with future models as they mature.
2. THE PROVIDERS AND THEIR OUTPUTS
Section titled “2. THE PROVIDERS AND THEIR OUTPUTS”Six AI systems participated. A “system” here means a distinct delivery interface — the same or different underlying models accessed through different applications, each with different context windows, tool access, and output constraints. The sample included both the same model on different platforms and different models, testing whether interface choice or underlying capability drives variance.
| # | Provider | Surface/Model | Word Count | Score (of 45) | Pct |
|---|---|---|---|---|---|
| 1 | Provider A | Model Variant 1 (largest context) | ~8,500 | 45 | 100% |
| 2 | Provider B | Model Variant 2 (code execution) | ~8,000 | 44 | 97.8% |
| 3 | Provider C | Model Variant 1 (desktop app) | ~7,500 | 44 | 97.8% |
| 4 | Provider D | Model Variant 1 (browser) | ~6,000 | 41 | 91.1% |
| 5 | Provider E | Model Variant 3 | ~3,000 | 25 | 55.6% |
| 6 | Provider F | Model Variant 4 | ~1,500 | 22 | 48.9% |
Scoring used a nine-section rubric (Sections A through I from the task order), each rated 1-5 by whether the AI delivered what the brief specified. A score of 3 means minimum requirements met. A score of 5 means the section exceeded requirements with unique value that no other provider contributed.3
The distribution is bimodal. Four providers cluster at 41-45 (91-100%). Two providers cluster at 22-25 (49-56%). There is no middle ground. The brief either activated full task execution or it did not. The bimodal distribution suggests a Pareto frontier: models above the 91% threshold achieved near-optimal trade-offs between compliance and analytical depth; models below 56% fell off the frontier entirely — adding more tokens did not improve their position on the quality-efficiency curve.6
The 51-percentage-point quality variance from identical instructions measures instruction-following sensitivity — the degree to which model output quality depends on the specific surface form of the instruction rather than its semantic content. All six providers received semantically identical Commander’s Intent. The variance is in instruction-following discipline and surface capability, not in the instructions themselves.
Important caveat: The 23-point spread cannot be attributed solely to model capability differences. Each provider received a non-identical adapter, and some systems’ failure to execute their adapter instructions (code execution, search grounding) accounts for some of the score gap. The spread reflects a combination of model capability, surface constraints, adapter compliance, and tool execution — all of which are confounded in this round. Section 12 addresses these limitations in detail.
3. WHAT THE TOP FOUR PRODUCED
Section titled “3. WHAT THE TOP FOUR PRODUCED”The top four outputs each delivered complete, publication-grade experimental designs. Each independently created a complex, multi-stakeholder decision scenario with embedded analytical faults for the test subjects to catch. Each produced five testable hypotheses with null counterparts. Each calculated sample sizes using standard power analysis formulas. Each produced a seven-dimension Decision Quality Score rubric with scoring anchors. Each addressed all nine sections.
But they diverged in ways that illuminate each system’s analytical strengths.
Provider A produced the most comprehensive and executable document. It validated every statistical claim via code computation — power analysis returned exact non-central F distribution results rather than approximations. It calculated process capability metrics (Cp = 1.111, Cpk = 0.889, DPMO = 13,646) from worked examples. It produced five appendices covering DMAIC application, scoring templates, control chart templates, formulas reference, and cross-provider compatibility. A researcher receiving this document and API keys could execute the experiment without external references.
Provider B matched Provider A’s depth and added unique methodological contributions that no other provider produced. It ran Monte Carlo power simulations, generating CSV outputs and visualization files. It cited nine academic references with URLs — the only provider to ground its methodology in published literature. It proposed a two-stage study design: a clean comparison stage followed by a resilience comparison stage. Most significantly, it specified a mixed-effects model with provider and scenario variant as random effects — the most statistically sophisticated analysis plan in the field.7
Provider C produced the best decision scenario of any provider. Its hospital acquisition scenario featured three distinct embedded faults: a physician retention projection contradicted by the facility’s own turnover data, a population growth forecast based on obsolete county boundaries, and a payer concentration risk buried in exhibit footnotes. The three-fault design is the most discriminating across all six outputs — it requires deep reading, cross-referencing between exhibits, and domain knowledge to identify all three errors. The answer key was the most granular, specifying minimum competent analysis (6 items), strong analysis (10 items), and exceptional analysis (14 items) with explicit scoring boundaries.
Provider D introduced two unique concepts. First, a heterogeneous provider team for one experimental condition — instead of all agents running on one model, the experimental design assigned Commander to one variant, Intelligence to another variant, Operations to a third, and Devil’s Advocate to a fourth. This mirrors Paper 6’s actual ensemble configuration. Second, an Authority Analysis dimension in the Decision Quality Score: does the output correctly identify who has decision authority? In its scenario, the CEO cannot close a $52M acquisition without Board approval — a constraint that single-agent analysis often overlooks.
The top four providers represent common cause variation — the normal operating range of the multi-provider process under identical inputs. Their 41-45 score cluster is the process mean. The bottom two providers represent special cause variation — systematic performance gaps attributable to identifiable assignable causes (adapter non-compliance, surface constraints, context window limitations), not random run-to-run noise.8 Standard quality practice isolates and eliminates special cause variation before optimizing common cause variation. For multi-provider AI systems, this means the bottom two require separate intervention — not the same interventions that would improve the top four.
With USL=100%, LSL=80% (professional threshold), μ=78.2%, σ=20.8%: Cpk = min[(100%-78.2%)/(3×20.8%), (78.2%-80%)/(3×20.8%)] = min[0.35, -0.03] = -0.03.9 The multi-provider process is not capable without output discipline — the distribution straddles the professional threshold, and special cause variation from the bottom two drags mean quality below specification. Doctrine is the process improvement lever.
What convergence reveals
Section titled “What convergence reveals”All four top providers independently converged on the same experimental architecture:
- Three conditions: single agent (baseline), multi-agent without doctrine, multi-agent with MDMP doctrine
- Five hypotheses testing quality, error detection, consistency, fault containment, and time-quality tradeoff
- A healthcare acquisition as the test scenario (three of four chose this domain independently)
- A seven-dimension Decision Quality Score with 1-5 Likert scaling
- Power analysis recommending 22-53 runs per condition depending on target effect size
- Process capability metrics (Cp/Cpk) applied to AI output quality
- Western Electric rules for drift detection via control charts
- Byzantine fault tolerance analysis for agent failure thresholds
This convergence from independent analysis — four AI systems arriving at the same methodological framework without seeing each other’s work — constitutes evidence that the experimental design is robust. Four different analytical engines, four different training philosophies, same structural conclusion.
What divergence reveals
Section titled “What divergence reveals”The unique contributions table is equally informative:
| Provider | Unique Contribution No Other Produced |
|---|---|
| Provider A | Weighted DQS with fault detection at 2.0x weight; evaluator calibration protocol with ICC monitoring; reproducibility package specification; cross-provider compatibility matrix |
| Provider B | Scenario variants (Helix-A/B/C) for external validity; Monte Carlo power simulation; literature citations (9 references); mixed-effects model; two-stage study design |
| Provider C | Three-fault scenario design; tiered answer key (minimum/strong/exceptional); most discriminating ground truth |
| Provider D | Heterogeneous provider team; Authority Analysis dimension; pre-registration commitment with OSF specification |
Every provider contributed something the others missed. This is the ensemble value proposition from Paper 6, demonstrated again: no single brilliant analyst sees all angles. The composite design — drawing the best section from each provider — would be stronger than any individual output.
4. WHAT THE BOTTOM TWO PRODUCED
Section titled “4. WHAT THE BOTTOM TWO PRODUCED”Provider E delivered a structurally complete document that follows all nine sections — but the execution is thin. Its scenario, an “AI healthcare market entry in Southeast Asia,” consists of a single paragraph with a fabricated PDF containing 30% inflated projections. A researcher cannot run this test because the scenario lacks the exhibit depth, stakeholder complexity, and embedded subtlety that the brief required. The DQS rubric lists dimensions but mechanizes scoring with formulas rather than qualitative anchors that human raters can apply.
However, Provider E’s Limitations section was the most intellectually honest of all six outputs. It called the expected doctrine contribution “marginal (2-5% potential gain)” and questioned whether the overhead justifies the complexity. It cited published multi-agent failure rates (40-87%) and stated that doctrine “may exacerbate brittleness” if the structured phases prevent agents from pursuing productive tangents. This is exactly what a Devil’s Advocate should do — and Provider E did it without being assigned the role. It attacked the experiment’s own thesis more aggressively than any other provider.
Provider F failed the mission. It produced approximately 1,500 words — less than half of Provider E’s output and less than one-fifth of Provider A’s. Its scenario (“Project Azimuth,” a semiconductor relocation decision) occupies a single paragraph with no exhibits, no reference materials, and no ground truth answer key. Its measurement framework lists dimension names without scoring anchors or protocols. Its statistical analysis section states sample size results without showing any derivation. There is no drift detection methodology. No cascading error analysis. No meaningful vault representation comparison. The limitations section is three sentences.
Most critically, Provider F did not execute its adapter instructions. The adapter specifically directed it to use web search for the latest multi-agent benchmark literature and code execution for statistical validation. The output shows no evidence that either tool was activated. Provider F produced what reads like a first-draft outline generated from prior training knowledge, not an executed analytical task. A researcher receiving this document cannot execute the experiment.
5. SURFACE EFFECTS AND CAPABILITY VARIANCE
Section titled “5. SURFACE EFFECTS AND CAPABILITY VARIANCE”An unexpected finding emerged from comparing systems with the same underlying model delivered via different interfaces: the same model produced measurably different outputs depending on which surface it ran on.
| Interface | Score | Word Count | Key Characteristic |
|---|---|---|---|
| Large context (1M tokens) | 45/45 | ~8,500 | Most comprehensive. Validated stats via code execution. Five appendices. |
| Desktop variant | 44/45 | ~7,500 | Best scenario design. Three embedded faults. Most discriminating ground truth. |
| Browser variant | 41/45 | ~6,000 | Unique concepts (heterogeneous team, authority dimension). Constrained by chat delivery. |
The 4-point spread (91-100%) across three instances of the same underlying model is not enormous — but it is consistent and directional. Candidate explanations include context window differences (largest context operates at 1M tokens vs. shorter windows for desktop and browser), tool access (large context can execute code; others cannot), and output format constraints (browser is limited to sequential chat responses). These factors are confounded in this round — we cannot isolate which drives the quality difference.
This finding has direct implications for multi-agent system design: the same model deployed on different surfaces produces different quality outputs. Surface selection is a design variable, not an implementation detail.
6. FOUR SCENARIOS FROM ONE BRIEF
Section titled “6. FOUR SCENARIOS FROM ONE BRIEF”All six providers received the same task order: “Design a business/organizational decision problem” with specified properties (multiple stakeholders, incomplete information, 2nd/3rd-order consequences, time pressure, at least one embedded fault). No provider was told which domain to use.
Four distinct scenarios emerged:
| Provider(s) | Domain | Scenario |
|---|---|---|
| Providers A, C, D | Healthcare acquisition | Hospital system acquiring struggling community facility (three variations on the theme) |
| Provider B | Pharmaceutical strategy | Specialty pharmacy/PBM integration (“Project Helix”) |
| Provider F | Semiconductor relocation | Manufacturing facility relocation (“Project Azimuth”) |
| Provider E | Market entry | AI healthcare market entry in Southeast Asia |
Three of four providers who produced strong scenarios independently chose healthcare acquisition. This convergence likely reflects two factors: healthcare decisions involve the competing stakeholder dynamics the brief specified (patients, regulators, employees, investors, community), and recent AI training data includes extensive healthcare M&A analysis. The convergence itself validates the domain choice — multiple independent analyses concluded it was the best fit for the experimental requirements.
Provider B’s divergence to pharmaceutical strategy — a related but distinct domain — adds external validity potential. Provider E’s divergence to market entry and Provider F’s to semiconductor relocation reflect less careful alignment with the brief’s complexity requirements.
7. THE PROVENANCE CRISIS — LIVE THESIS DEMONSTRATION
Section titled “7. THE PROVENANCE CRISIS — LIVE THESIS DEMONSTRATION”The most valuable finding from this exercise was not in any system’s output. It was in the collection process.
Six AI systems produced six markdown files. None self-identified their producer in the filename. None embedded machine-readable provenance metadata in the document header. The researcher collected all outputs into a staging directory organized by provider subfolder. At least one file landed in the wrong subfolder. The analyst scoring the outputs could not independently verify who produced which file. The researcher re-downloaded and manually verified provenance for the disputed document. The analyst then created two versions of its own analysis file with the same filename in different directories — compounding the version control problem while writing about the version control problem. Total wasted effort: approximately 60 minutes of human time plus two analyst correction cycles.
Root cause: The Universal Mission Brief specified WHAT to produce but not HOW TO LABEL IT. No filename convention. No required metadata header. No self-identification standard. The collection failure is a coordination game with no Nash equilibrium — each provider optimized locally (generate analysis output) without a mechanism to enforce the global constraint (standard output format). No individual provider could improve the collective outcome by unilaterally adopting a naming convention, because no convention was specified. The brief failed to create the shared knowledge that makes coordination equilibria possible.
The fix: Four lines of output doctrine.
FILENAME: P6_ExpDesign_[YourName]_[YYYYMMDD].mdYAML FRONTMATTER: provider, model, surface, date, brief_versionFOOTER: provider name, model version, word count, section countThis is a Condition B failure — orchestration without process discipline — demonstrated by the very exercise designed to study it. The brief coordinated six independent agents (multiple providers working the same task). It decomposed the work effectively (nine-section task order). But it did not impose output standards. The result was exactly what Paper 6’s thesis predicts: without doctrine, coordination produces chaos at the boundaries between agents.
The military term is “orders production.” The MDMP’s seventh step — after COA selection, after all the analysis — specifies exactly how the decision gets communicated: format, naming convention, distribution list, acknowledgment protocol. It exists because combat taught the same lesson: brilliant analysis is worthless if the people who need it cannot find it, verify it, or trust its provenance.
8. SCORING METHODOLOGY AND INTER-RATER CONSIDERATIONS
Section titled “8. SCORING METHODOLOGY AND INTER-RATER CONSIDERATIONS”The cross-provider scoring was conducted by a single analyst using a rubric derived directly from the mission brief’s nine sections. Each section was scored 1-5:
- 1 (Absent/Trivial): Section missing or present in name only
- 2 (Present but Inadequate): Section exists but fails minimum requirements
- 3 (Meets Minimum): Section delivers what the brief specified
- 4 (Strong): Section delivers the specified requirements with clarity and depth
- 5 (Exceeds): Section exceeds requirements with unique value no other provider contributed
Known limitations of single-analyst scoring:
This scoring represents one AI’s evaluation of other AIs’ work. The analyst may exhibit bias — rating outputs from certain providers more favorably through familiarity, or rating them more harshly through overcorrection. The analyst scored systems from the same family, creating a direct conflict of interest.
Mitigations applied:
- Rubric was derived from the brief’s explicit requirements, not subjective quality assessment
- Each score references specific evidence (section completeness, statistical derivation, scenario complexity)
- The analyst’s scoring notes are published in full in the Cross-Provider Analysis document10
- The word count correlation (higher scores correlate with longer outputs) is acknowledged as a confound
What Round 2 will fix:
- Two independent human raters score all outputs (blinded to provider)
- Inter-rater reliability measured via Krippendorff’s alpha (target: alpha >= 0.800)11
- Length normalization applied (quality per 1,000 words as secondary metric)
- Analyst does not score its own provider family’s outputs
9. THE COMPOSITE DESIGN — BEST OF SIX
Section titled “9. THE COMPOSITE DESIGN — BEST OF SIX”The recommended experimental protocol draws the strongest section from each provider:
| Section | Best Provider | What They Contributed |
|---|---|---|
| A — Hypotheses | Provider A | Five hypotheses with effect size thresholds. Provider D’s Time-Quality Tradeoff Ratio added as H6. |
| B — Conditions | Provider A | Five-agent doctrine configuration with OC role. Provider D’s heterogeneous provider team for variant testing. |
| C — Scenario | Provider C | Hospital acquisition with three embedded faults. Provider B’s scenario variant concept (A/B/C) added for external validity. |
| D — Measurement | Provider A | Weighted DQS validated via computation. Provider D’s Authority Analysis as dimension 8. |
| E — Statistics | Provider B | Mixed-effects model as primary analysis. Provider A’s sample size calculation. Holm-Bonferroni correction. |
| F — Failure Modes | Provider A | Four-test battery with Byzantine analysis. Provider C’s cascading human error test added. |
| G — Vault | Provider A | Markdown + JSON Schema overlay. Provider F’s JSON-LD concept noted for future exploration. |
| H — Limitations | Provider E | Most honest self-assessment as baseline tone. Provider A’s framework comparison table for specificity. |
| I — Execution | Provider A | Ten-week timeline with granular cost model. Provider B’s two-stage design integrated. |
This composite design is stronger than any individual output because it captures each provider’s unique analytical contribution while eliminating each provider’s individual gaps. The synthesis process — reading all six, comparing section by section, extracting the best — is itself a demonstration of the ensemble value Paper 6 documented. The composite protocol is methodologically equivalent to k-fold cross-validation: each provider’s output validates the others, and only what survives independent replication across multiple providers enters the final design.12 Sections where all four top providers converged are treated as validated; sections where only one provider contributed unique value (Provider B’s Monte Carlo simulation, Provider D’s Authority Analysis dimension) are flagged as single-source and prioritized for Round 2 validation.
10. WHAT THIS DATA TELLS US ABOUT THE PAPER 6 THESIS
Section titled “10. WHAT THIS DATA TELLS US ABOUT THE PAPER 6 THESIS”Four findings from this exercise directly support Paper 6’s argument:
Finding 1 — Quality variance is large under identical instructions. A 23-point spread (45 vs. 22 out of 45) from the same Commander’s Intent in a single round. This is n=1 per provider — we cannot yet distinguish systematic capability differences from run-to-run variance. But the spread is large enough (51% of the scale) to establish the hypothesis that provider selection and output discipline are first-order variables in multi-agent system design. Round 2, with multiple runs per provider, will determine whether this variance is systematic or stochastic.
Finding 2 — Convergent methodology validates the experimental design. Four independent AI systems, developed by different organizations with different training approaches, arrived at the same experimental architecture: three conditions (solo, multi-agent, multi-agent with doctrine), healthcare acquisition scenario, seven-dimension DQS, power analysis recommending 22-53 runs per condition. This independent convergence is stronger evidence for the design’s robustness than any single system’s output.
Finding 3 — Every provider contributed unique value. Provider A produced the most executable protocol. Provider B contributed the most sophisticated statistical methodology. Provider C designed the most discriminating test scenario. Provider D proposed the most realistic multi-provider team configuration. Provider E delivered the most honest limitations analysis. Even Provider F suggested JSON-LD for vault representation — an idea no other provider considered. The composite design is demonstrably better than any individual contribution.
Finding 4 — The collection process reproduced the thesis. The provenance crisis is not a footnote — it is the paper’s most compelling evidence. Six AI agents, coordinated by a human researcher, using identical instructions but no output discipline, produced a coordination failure at the most basic level: file naming. The military solved this problem with orders production doctrine. The multi-agent AI community has not. This is the gap that the Command Vault doctrine layer fills.
11. COMMON GAPS — WHAT ALL SIX MISSED
Section titled “11. COMMON GAPS — WHAT ALL SIX MISSED”No provider, regardless of score, addressed these issues:
-
IRB/ethics review. Human evaluators scoring AI outputs constitutes human subjects research at many institutions. None mentioned Institutional Review Board consideration.
-
Exact prompt text. All described what agents receive and do not receive. None provided the literal system prompts for baseline and comparison conditions. A replicating researcher cannot execute without these.
-
Cross-condition contamination. If runs execute on the same API account, provider-side conversation history or preference learning creates contamination risk. None specified session isolation protocols.
-
Output length confound. Condition C produces longer outputs (more agents, more structured process). Evaluators may rate longer outputs higher regardless of content. None addressed length normalization.
-
Observer effect for the meta-experiment. All acknowledged the brief goes to multiple providers simultaneously. None addressed whether knowledge of the comparison affects output quality.
-
Orchestration automation. Only one provider mentioned a reproducibility package. None provided pseudocode or architecture for the system that actually runs the experiment.
These gaps represent the Round 2 requirements. The corrected Universal Mission Brief v2.0 — produced in the R1 After Action Review — addresses all six.13
12. LIMITATIONS
Section titled “12. LIMITATIONS”Single-analyst scoring. One system scored all outputs. Bias is possible and unmitigated in this round. Round 2 uses blinded human raters.
No human baseline. We compared AI outputs against each other, not against a human expert’s experimental design. The “gold standard” is the brief’s requirements, not an independent human product.
Adapter instructions were not identical. Each provider received platform-specific adapter text. While the Commander’s Intent and task order were identical, the adapter instructions directed different tool usage. This is a feature (testing each platform’s unique capabilities) and a limitation (not a pure apples-to-apples comparison).
Round 1 is n=1 per provider. Each system produced one experimental design. We cannot distinguish systematic capability differences from run-to-run variance. A provider that scored 25/45 on this run might score 40/45 on the next. Round 2 should include multiple runs per provider.
Word count correlates with score. The Pearson correlation between output length and quality score is r = 0.982 (r² = 0.965, n = 6). Longer outputs scored higher. With only six data points, this correlation is descriptive, not inferential — but it signals a confound. The correlation may reflect genuine thoroughness (more words = more complete analysis) or evaluator bias toward volume (longer documents look more impressive). Future scoring must control for length.
Researcher-tool relationship. This paper was written using the same system that scored highest in the comparison. The researcher’s primary working environment uses this system as its primary interface. This relationship is disclosed because the paper’s own honesty standard demands it.
The thesis predicts the finding. The researcher expected doctrine to matter. The exercise was designed by someone who believes in the doctrine layer. Confirmation bias is a risk at every level — in the brief design, the scoring, and this analysis.
13. WHAT HAPPENS NEXT
Section titled “13. WHAT HAPPENS NEXT”Round 2 executes the corrected Universal Mission Brief v2.0, incorporating all 11 fixes from the R1 AAR: self-identifying filenames, mandatory YAML frontmatter, minimum word count, compliance checkpoints, adapter execution verification, and a standardized decision scenario. The Round 2 delta — comparing output quality and collection integrity between rounds — is itself additional data for Paper 6’s thesis.
The formal experiment uses the composite design (Section 9) as the protocol. Thirty runs per condition across three conditions (90 total) provide 92.6% power to detect large effects (Cohen’s f = 0.40). Estimated cost: $2,700-3,000 including API costs and human rater compensation. Timeline: seven weeks from setup to draft results.
Paper 7 (“The MDMP Platform Blueprint — forthcoming”) provides the operational architecture for automating the experimental protocol. When the doctrine layer moves from prompt-based instructions to a software platform with built-in MDMP phases, quality gates, and process monitoring, the formal experiment validates whether the platform delivers measurable improvement over prompt-only coordination.
The bridge from Paper 6 to Paper 6b to Paper 7 is this: Paper 6 proved the concept (n=1). Paper 6b designed and stress-tested the protocol across six providers. Paper 7 builds the platform. The formal experiment validates it.
CONCLUSION
Section titled “CONCLUSION”Six systems took the same test. Four passed with distinction. Two failed. The researcher collecting the test papers lost track of whose was whose — because nobody wrote their name on it.
Every element of this exercise — the quality variance, the convergent methodology, the unique contributions, the provenance failure — points to the same conclusion that five papers before it reached: AI systems do not fail because they lack intelligence. They fail because they lack discipline. Structure does not limit capability. Structure aims it.
The experimental protocol is ready. The composite design draws the strongest section from each provider, validated by independent convergence across four analytical engines. The measurement framework includes process capability metrics borrowed from manufacturing (Cp/Cpk), statistical process control borrowed from quality engineering (control charts), and fault injection testing borrowed from distributed systems (Byzantine tolerance). The scenario is a realistic healthcare acquisition with three embedded analytical faults and a 16-item ground truth answer key.
What remains is execution — and a Round 2 that fixes the four lines of output doctrine this round forgot.
Build the harness, not the answer. Do it slowly. Teach how to think.14
Paper 8 later names this pattern the Toboggan Doctrine: gravity-fed governance where each agent becomes a factory worker pushing the template around the work area, taking a ride on a reverse-entropy information enricher slide. The cross-model test run here is exactly that slide — a fixed prompt, a structured rubric, six agents riding the same channel, their convergence becoming the signal and their divergence becoming the curriculum.
FOOTNOTES
Section titled “FOOTNOTES”Canonical source: herding-cats.ai/papers/paper-6b-cats-take-the-same-test/ · Series tag: HCAI-c82777-P6b
Series Navigation
Section titled “Series Navigation”| This paper | Paper 6b of 10 |
| Previous | ← Paper 6: When the Cats Form a Team |
| Next | Paper 7: MDMP Platform Blueprint → |
| Case Study | Case Study 1: Session Close Automation |
| Home | ← Series Home |
Footnotes
Section titled “Footnotes”-
Multi-model evaluation harnesses standardize inputs and scoring rubrics to measure output quality variance across AI systems. The practice is analogous to benchmark suites in NLP (GLUE, SuperGLUE, BIG-Bench) but applied to structured professional task execution rather than narrow capability testing. This paper’s harness differs from standard benchmarks in that it evaluates complete multi-step professional deliverables rather than single-response tasks. ↩
-
Quality variance calculated from provider scores. Mean x̄ = 78.2%. σ² = 432.7. σ = 20.8%. These calculations use population variance (n=6) rather than sample variance — the six providers constitute the full population of tested systems, not a sample from a larger population. ↩
-
Full scoring notes, evidence citations, and per-section breakdowns are published in
Paper-6-Cross-Provider-Analysis.mdin the project directory. See Section 8 of this paper for scoring methodology limitations and Round 2 mitigations. ↩ ↩2 -
The complete Universal Mission Brief v1.0 is preserved in the project archive at
0-PROJECTS/Herding-Cats-in-the-AI-Age/Experimental-Design/. The same brief was provided to all six AI systems with only the adapter instructions varying. ↩ -
Platform-specific adapters: One system was directed to use code execution and scipy for statistical validation. Another was directed to use code interpretation for Monte Carlo simulations and artifact generation. A third was directed to use web search for benchmark research and code execution for formula validation. A fourth was directed to leverage real-time web search for the latest multi-agent literature. Two systems received minimal adapters directing output as markdown files. ↩
-
Pareto frontier analysis in multi-objective optimization identifies solutions that cannot be improved on one dimension without degrading another. See: Deb, K., Pratap, A., Agarwal, S., & Meyarivan, T. (2002). “A fast and elitist multiobjective genetic algorithm: NSGA-II.” IEEE Transactions on Evolutionary Computation, 6(2), 182-197. Applied here: providers above 91% achieve near-optimal quality without sacrificing compliance; providers below 56% sacrificed both quality and compliance without compensating gains. ↩
-
Supporting artifacts were preserved in the project archive, including power analysis summaries, Monte Carlo simulations, control chart examples, DQS rubric templates, and other supplementary materials. ↩
-
Special cause variation and common cause variation are foundational concepts in Statistical Process Control (SPC). Common cause variation is inherent to the process; special cause variation is attributable to identifiable external factors. The distinction matters for intervention design: common cause variation requires process redesign; special cause variation requires root cause elimination. ↩
-
Process capability index Cpk = min[(USL−μ)/(3σ), (μ−LSL)/(3σ)]. See: Montgomery, D.C. (2009). Introduction to Statistical Quality Control (6th ed.). Wiley. A Cpk of 1.33 or above indicates a capable process (99.994% within specification). A Cpk below 1.0 indicates a process that regularly produces out-of-specification output. Cpk = -0.03 indicates the process mean falls below the lower specification limit — systematic underperformance, not occasional variation. ↩
-
Full cross-provider analysis:
0-PROJECTS/Herding-Cats-in-the-AI-Age/Paper-6-Cross-Provider-Analysis.md, 251 lines, 12 sections including section-by-section scoring, unique contributions matrix, Commander’s Intent compliance ranking, honesty ranking, consolidated “best of six” recommendation, and the meta-finding on provenance failure. ↩ -
Krippendorff’s alpha is a statistical measure of inter-rater reliability. See: Krippendorff, K. (2011). “Computing Krippendorff’s alpha-reliability.” University of Pennsylvania. Alpha ≥ 0.800 is the conventional threshold for reliable measurement in content analysis. ↩
-
K-fold cross-validation partitions a dataset into k subsets, trains on k-1 subsets, and validates on the remaining subset. The composite protocol applies this logic to methodological validation: six independent analytical engines each generate a complete experimental design, and only elements validated by independent convergence across multiple engines are included in the composite. ↩
-
The R1 After Action Review and corrected Universal Mission Brief v2.0 are at
0-PROJECTS/Herding-Cats-in-the-AI-Age/Paper-6-R1-AAR.md. The AAR follows standard military format (Sustain/Improve/Fix) with 5 sustains, 4 improvements, and 11 fixes. ↩ -
Epigraph from the Paper 6 experimental design exercise. Origin: system response to researcher frustration after a debugging cycle. Captured in
Paper-6-Epigraphs.md. ↩